

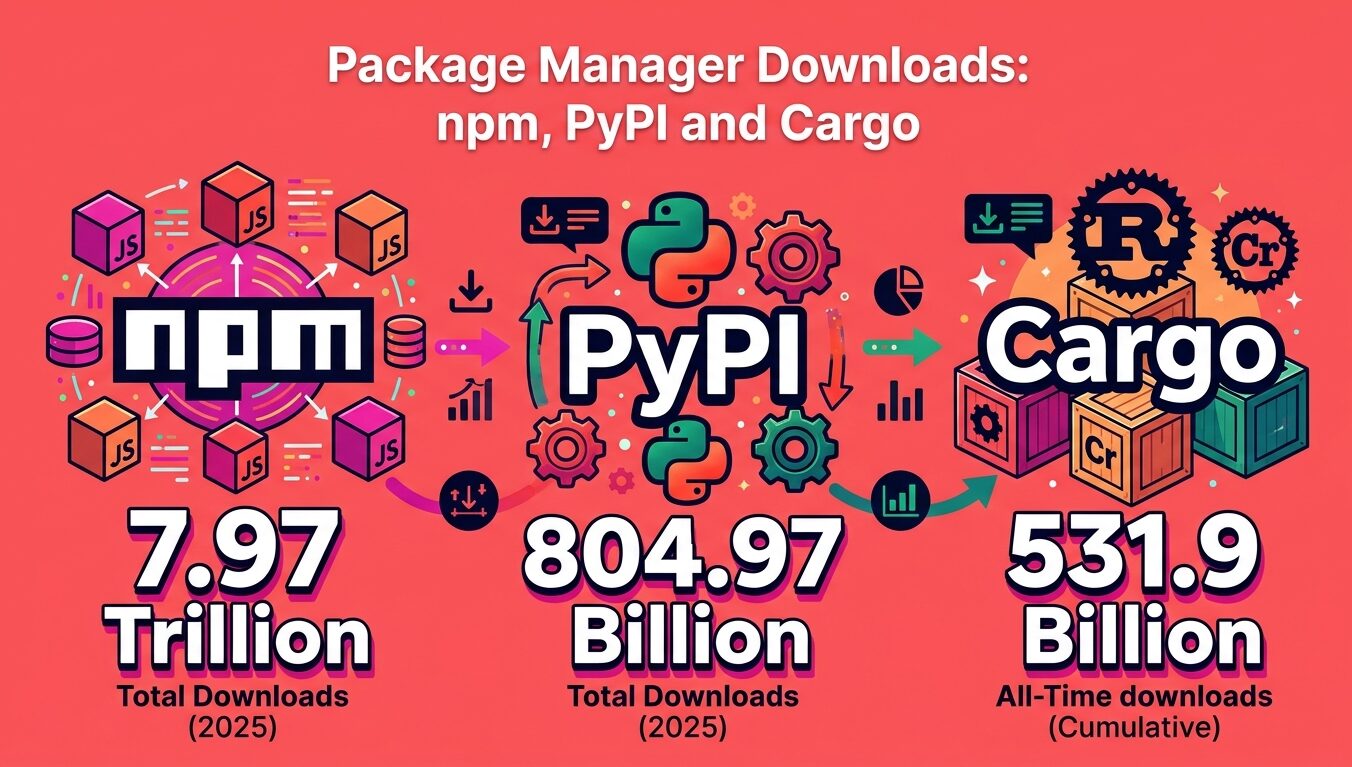
npm served 7.97 trillion package downloads in 2025, against 804.97 billion for PyPI, according to Sonatype’s 2026 State of the Software Supply Chain report. This guide covers package manager downloads across npm, PyPI, and crates.io: registry totals, release volume, PyPI request traffic, Cargo’s all-time counter, who generates crates.io load, 2026 developer survey usage, and malware figures. Each number is labeled with what it measures and when.
Package Manager Downloads
Package Manager Downloads by Registry in 2025
Sonatype counted 9.8 trillion downloads across Maven Central, PyPI, npm, and NuGet in 2025. npm accounted for 7.97 trillion of them.
Maven Central placed second at 839.05 billion. PyPI followed at 804.97 billion, and NuGet recorded 223.37 billion.
| Registry | Downloads (2025) | YoY download growth |
|---|---|---|
| npm (JavaScript) | 7.97 trillion | 65.43% |
| Maven Central (Java) | 839.05 billion | 19.42% |
| PyPI (Python) | 804.97 billion | 50.64% |
| NuGet (.NET) | 223.37 billion | 17% |
Sonatype says most registry traffic does not come from new applications. The report points to transitive dependency sprawl, unused or abandoned packages, and unsustainable tooling patterns instead.
The same report ties PyPI’s growth to workloads around AI and cloud development. crates.io sits outside Sonatype’s four-registry dataset, so its figures appear separately below.
npm Published Over 60% of New Releases in 2025
npm added 11.18 million releases in 2025. Maven Central added 3.3 million, NuGet 2.4 million, and PyPI 1.54 million.
Sonatype says npm produced over 60% of all new releases across the four registries it tracks. The report describes npm’s impact as driven by release velocity, not catalog size.
| 2025 metric | npm | PyPI | Maven Central | NuGet |
|---|---|---|---|---|
| Components added | 749.7k | 214.8k | 260.5k | 144.8k |
| Cumulative components | 5.59M | 821.3k | 808.6k | 760.1k |
| Releases added | 11.18M | 1.54M | 3.3M | 2.4M |
| Cumulative releases | 65.56M | 8.85M | 24.95M | 14.02M |
Sonatype recorded 838,778 npm releases associated with CVSS 9.0+ vulnerabilities in 2025. For a parallel view of severity scoring at the OS level, see our Linux CVE severity breakdown.
On PyPI, one in five 2025 releases was tied to a CVSS 7.0+ vulnerability. Components added in 2025 made up 26% of the PyPI catalog, per Sonatype.
What Does PyPI Actually Count?
PyPI’s own 2025 review reports requests, not package downloads. The index served 2.56 trillion requests, an average of 81,000 per second, and transferred 1.92 exabytes.
That request total and Sonatype’s 804.97 billion downloads measure different things. They should not be read as the same metric.
Publishing activity reached more than 3.9 million new files and more than 130,000 new projects in 2025. Sonatype’s count of PyPI components added is 214.8k; both figures appear here as each source published them.
Over 50,000 projects now use Trusted Publishing, which handled more than 20% of file uploads in the year. 17% of uploads included an attestation.
More than 52% of active users had phishing-resistant 2FA enabled. Organizations on PyPI reached 7,742, managing 9,059 projects.
Cargo Downloads Reach 531.9 Billion on crates.io
The crates.io counter showed 531,939,459,323 all-time downloads and 369,255 crates at the time of writing in November 2026.
That is a cumulative count since launch. It does not line up with Sonatype’s single-year totals for npm and PyPI.
Which Rust Crates Get Downloaded Most?
hashbrown, a Rust port of Google’s SwissTable hash map, leads all-time with 3.0 billion downloads. syn follows at 2.9 billion and getrandom at 2.5 billion.
The same three crates top crates.io’s recent-downloads list: hashbrown at 844 million, syn at 823 million, and getrandom at 751 million.
Who Generates crates.io Traffic?
crates.io handled 641 million requests on June 5, 2026. Declared AI agents sent 2.27 million of them, or 0.3%.
The Rust Foundation estimates that AI requests, including agents that do not identify themselves, probably account for 3% to 30% of all requests.
Continuous integration runs generate on the order of 50% of crates.io traffic, by the Foundation’s estimate. Pipeline tooling trends are tracked in our DevOps and CI/CD adoption figures.
Most traffic reaches crates.io from AWS, Azure, and Google Cloud. The Foundation had forecast 18 to 19 PB of bandwidth for 2026 and almost reached it in the first half of the year.
npm vs pip vs Cargo Usage in the 2026 Developer Survey
Stack Overflow’s 2026 survey is opt-in, with 30,903 total responses. The question covering package managers drew 10,889 respondents.
npm ranked highest among the package managers listed, used by 54.6% of those respondents. pip reached 42.1%, uv 23.3%, and Cargo 16.3%.
| Package manager | Ecosystem | Used (past year) | Admired | Desired |
|---|---|---|---|---|
| npm | JavaScript | 54.6% | 37.9% | 21.7% |
| pip | Python | 42.1% | 38.0% | 17.1% |
| uv | Python | 23.3% | 60.9% | 17.2% |
| pnpm | JavaScript | 19.0% | 49.3% | 11.3% |
| NuGet | .NET | 18.6% | 49.5% | 10.1% |
| Yarn | JavaScript | 16.7% | 27.3% | 5.6% |
| APT | Debian/Ubuntu (system) | 16.6% | 55.2% | 10.1% |
| Cargo | Rust | 16.3% | 65.4% | 13.9% |
| Maven | Java | 15.3% | 39.4% | 7.0% |
| Pacman | Arch Linux (system) | 9.1% | 58.9% | 6.4% |
| Bun | JavaScript | 8.7% | 45.3% | 6.8% |
| Poetry | Python | 7.4% | 25.3% | 3.0% |
| Conda | Python | 6.6% | 32.7% | 3.2% |
JavaScript was used by 62.0% of respondents to the survey’s language question. Rankings across several indices appear in our web development language statistics.
Cargo and uv Top the Admired Scores
Cargo’s 65.4% admired score was the highest in the 2026 cloud development question. In the 2025 edition, Cargo scored 71% on the same measure.
Rust usage reached 18.0% of language respondents in 2026. Enterprise uptake and salaries are covered in our Rust adoption statistics.
How Much Malware Reaches Package Manager Downloads?
Sonatype identified more than 454,600 new malicious packages in 2025, taking its cumulative total past 1.233 million. Over 99% of 2025 open-source malware occurred on npm.
| 2025 campaign | Registry | Malicious packages |
|---|---|---|
| IndonesianFoods | npm | 169,538 |
| Lazarus Group-linked | 97% on npm | 800+ |
| Shai-Hulud (Sept. 2025) | npm | 500+ |
| Shai-Hulud: The Second Coming (Nov. 2025) | npm | 49 |
PyPI processed more than 2,000 malware reports in 2025. It handled 66% within four hours and 92% within 24 hours, a pace worth setting against Linux security patch release times.
On crates.io, typosquatted faster_log was downloaded 7,181 times and async_println 1,243 times. Both were deleted on September 24, 2025, and neither had dependent crates on the registry.
FAQs
Which package manager has the most downloads?
npm. Sonatype counted 7.97 trillion npm package downloads in 2025, compared with 839.05 billion for Maven Central, 804.97 billion for PyPI, and 223.37 billion for NuGet.
How many downloads does PyPI get per year?
Sonatype counted 804.97 billion PyPI downloads in 2025, up 50.64% year over year. PyPI’s own 2025 review reports 2.56 trillion total requests served, which is a separate measure.
How many crates are on crates.io?
The crates.io counter listed 369,255 crates in November 2026, with 531.9 billion all-time downloads. hashbrown is the most downloaded crate at 3.0 billion.
Is uv replacing pip?
Not on usage yet. In the 2026 Stack Overflow survey, 42.1% of respondents used pip and 23.3% used uv. uv’s admired score was higher, at 60.9% versus 38.0% for pip.
Are npm download counts inflated, as Reddit threads often ask?
Downloads are not users. Sonatype says most registry traffic comes from transitive dependency sprawl, abandoned packages, and CI/CD patterns, and self-replicating campaigns added 171,740 malicious packages to npm in 2025.
Sources
https://www.sonatype.com/state-of-the-software-supply-chain/2026/software-infrastructure-growth
https://blog.pypi.org/posts/2025-12-31-pypi-2025-in-review/
https://opensource.datadoghq.com/projects/rust-foundation/
https://survey.stackoverflow.co/2026/technology/data
https://commandlinux.com/statistics/linux-malware-vulnerability-statistics/
