

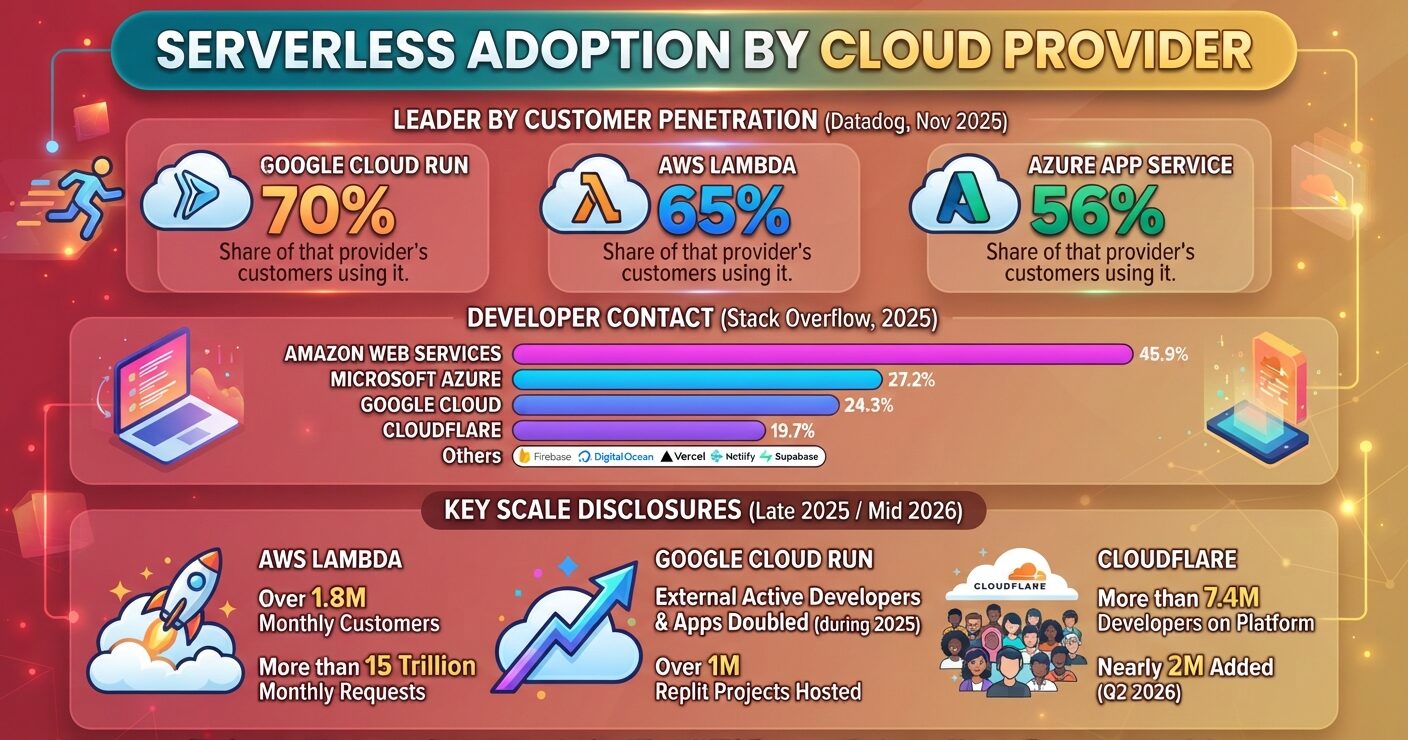
Serverless adoption by cloud provider is counted three ways, and the three disagree. Datadog measures penetration inside each provider’s own customer base. Stack Overflow counts developers who worked with each platform. Providers publish their own scale figures, each in a different unit. This page sets out what every number actually measures, with its period attached, and flags where the figures cannot be combined.
Serverless Adoption by Cloud Provider
- Google Cloud Run is used by 70% of Google Cloud customers, the highest penetration Datadog recorded for any serverless offering in November 2025.
- AWS Lambda serves over 1.8 million customers each month and processes more than 15 trillion requests a month, per AWS at re:Invent in December 2025.
- Cloudflare closed the quarter ended 30 June 2026 with more than 7.4 million developers on its platform, nearly 2 million of them added in that quarter.
- 66% of organisations running serverless functions also run a container orchestration service in the same cloud.
- AWS held 28% of worldwide cloud infrastructure spending in Q2 2026, Microsoft 20% and Google 15%.
Serverless Adoption by Cloud Provider Inside Each Customer Base
Datadog analysed telemetry from tens of thousands of its own customers and published the result on 6 November 2025. Cloud Run leads on this measure, not Lambda.
The figure is penetration within each provider’s customer base, so the three columns are not comparable headcounts. Datadog counted an organisation as a cloud customer if it ran at least five hosts a month there, and as a service customer if it ran at least five functions or one application a month on that service.
| Provider | Most-used serverless offering | Share of that provider’s customers using it |
|---|---|---|
| Google Cloud | Cloud Run | 70% |
| Amazon Web Services | AWS Lambda | 65% |
| Microsoft Azure | Azure App Service | 56% |
Source: Datadog, 2025 State of Containers and Serverless, November 2025
Only one of the three leading offerings is classic function-as-a-service. Google Cloud’s most-adopted serverless product is a container platform, and Azure’s is App Service rather than Azure Functions. Datadog notes its sample skews toward organisations that already lean heavily on cloud platforms.
Do Serverless Users Also Run Containers?
Datadog found 66% of organisations using serverless functions also run at least one container orchestration service in the same cloud, leaving 34% on serverless alone. The choice is rarely exclusive. Which engines sit underneath those workloads is covered in these container runtime market share figures.
Source: Datadog, 2025 State of Containers and Serverless, November 2025
Which Cloud Platforms Do Developers Work With?
The Stack Overflow 2025 Developer Survey asked which cloud platforms and infrastructure tools respondents had done extensive development work in over the past year. It is an opt-in survey, published 29 July 2025, drawing 49,000+ responses from 177 countries. The cloud question drew 24,473 responses from all respondents and 20,070 from professional developers, and respondents could select more than one platform.
These percentages measure developer contact with a platform, not serverless usage and not market share. Cloudflare, the only platform in the top four whose compute story is entirely serverless, lands 4.5 points behind Google Cloud.
| Platform | All respondents | Professional developers |
|---|---|---|
| Amazon Web Services | 43.3% | 45.9% |
| Microsoft Azure | 26.3% | 27.2% |
| Google Cloud | 24.6% | 24.3% |
| Cloudflare | 20.1% | 19.7% |
| Firebase | 13.1% | 13.3% |
| Digital Ocean | 10.7% | 11.1% |
| Vercel | 10.6% | 10.8% |
| Netlify | 5.9% | 5.7% |
| Supabase | 5.4% | 5.4% |
Source: Stack Overflow 2025 Developer Survey, July 2025
Professional Developers Versus All Respondents
Three platforms slip when hobbyists are excluded: Google Cloud to 24.3% from 24.6%, Cloudflare to 19.7% from 20.1%, Netlify to 5.7% from 5.9%. AWS moves the other way and gains 2.6 points.
What Each Provider Discloses About Serverless Scale
Vendor disclosures are selective by design, and no two use the same unit. AWS publishes request volume, Google Cloud publishes growth multiples, Cloudflare publishes developer headcount. Microsoft publishes none of the three, which makes Azure the weakest-covered provider in this set.
| Provider | Disclosed metric | Value | Date |
|---|---|---|---|
| AWS Lambda | Monthly customers | Over 1.8 million | Dec 2025 |
| AWS Lambda | Requests per month | More than 15 trillion | Dec 2025 |
| AWS Lambda | Invocations per day, Prime Day | Over 1.7 trillion | Jul 2025 |
| Google Cloud Run | External active developers and applications | Doubled during 2025 | Apr 2026 |
| Google Cloud Run | Live Replit projects hosted | Over 1 million | Apr 2026 |
| Cloudflare | Developers on the platform | More than 7.4 million | Q2 2026 |
| Cloudflare | Developers added in the quarter | Nearly 2 million | Q2 2026 |
Sources: Amazon Web Services (December 2025 and July 2025); Google Cloud (April 2026); Cloudflare Q2 2026 earnings call, quarter ended 30 June 2026
AWS reports the two Lambda volumes in different units, requests in one case and invocations in the other, so they are not directly comparable. Google Cloud stated that more new customers and applications arrived on Cloud Run during 2025 than in its first six years combined.
Cloudflare’s quarter is the sharpest movement in the set. Nearly 2 million developers joined in the three months to 30 June 2026, against 1.5 million added across all of 2025. None of these metrics measures the same thing, which is why no vendor-disclosed table produces a serverless market share.
Serverless Adoption by Cloud Provider Against Infrastructure Spending Share
Synergy Research Group put Q2 2026 enterprise spending on cloud infrastructure services at $143.4 billion, up 43% year on year, the 11th successive quarter in which the growth rate increased. Its shares measure revenue, not customers or functions.
| Provider | Worldwide cloud infrastructure share, Q2 2026 |
|---|---|
| Amazon Web Services | 28% |
| Microsoft | 20% |
| 15% |
Source: Synergy Research Group, Q2 2026 cloud infrastructure services data, July 2026
Revenue share and customer penetration are different measurements drawn from different populations, so multiplying one by the other does not produce a serverless footprint. Google Cloud converts the highest proportion of its customers to serverless while holding the smallest revenue share of the three. Quarterly movements behind those shares sit in this AWS, Azure and GCP share breakdown, and the operating system split across the same fleets appears in this cloud provider Linux usage analysis.
How Many Developers Work Cloud Native?
CNCF and SlashData surveyed more than 12,500 developers across 100+ countries between December 2025 and January 2026. The Q1 2026 edition counts 19.9 million cloud native developers globally, roughly 39% of the developer population, up from 15.6 million in Q3 2025.
Among backend developers, 52% met the cloud native threshold in Q1 2026, down from 58% in Q3 2025 but above the 49% recorded in Q1 2025. CNCF flags the Q3 2025 reading as possibly elevated and says the Q3 2026 wave will clarify the baseline.
Source: CNCF and SlashData, State of Cloud Native Development Q1 2026, March 2026
Serverless trails foundational patterns in the same survey. API gateways reach 47% of backend developers and microservices 39%, against 27% for Kubernetes. The Q1 2026 backend infrastructure table does not break out cloud functions as a separate line, so no comparable serverless percentage is published for that wave. Pipeline practice among these teams is detailed in these DevOps and CI/CD adoption statistics, and orchestration context sits in these Kubernetes adoption figures.
Is Serverless Moving to Arm?
Arm migration is one of the few serverless trends measured consistently on both sides. Datadog found the share of AWS Lambda functions running on Arm rather than x86 grew from 9% to 19% over two years, against 9% to 15% for cloud instances generally.
Source: Datadog, 2025 State of Containers and Serverless, two-year period ending 2025
What Serverless Adoption by Cloud Provider Data Does Not Measure
No public dataset counts production functions per provider. Datadog measures its own customer telemetry, which skews toward organisations already buying observability tooling.
Stack Overflow measures self-reported platform contact, where one weekend project counts the same as a fleet of 5,000 functions. Its cloud question also mixes platforms, package managers and build tools in a single list.
Azure Functions is never separated from App Service in the one study that breaks out serverless by product, and Microsoft publishes neither request volume nor developer counts. Broader infrastructure context is available in these cloud infrastructure market share statistics and this server operating system breakdown.
FAQs
Which cloud provider has the highest serverless adoption?
Google Cloud. Cloud Run is used by 70% of Google Cloud customers, ahead of AWS Lambda at 65% of AWS customers and Azure App Service at 56% of Azure customers, per Datadog’s November 2025 report.
How many requests does AWS Lambda handle?
More than 15 trillion requests per month from over 1.8 million monthly customers, as stated by AWS at re:Invent in December 2025. During Prime Day 2025, Lambda handled over 1.7 trillion invocations in a single day.
How many developers use Cloudflare Workers?
Cloudflare reported more than 7.4 million developers on its platform at the close of the quarter ended 30 June 2026, having added nearly 2 million during that quarter alone, more than the 1.5 million added across all of 2025.
What does Reddit say about serverless versus containers?
Reddit threads are anecdotal and measure nothing. Datadog’s telemetry is the closest verified answer: 66% of organisations using serverless functions also run a container orchestration service in the same cloud, and 34% run serverless alone.
Is there a serverless market share by provider?
No. AWS publishes request volume, Google Cloud publishes growth multiples, Cloudflare publishes developer counts and Microsoft publishes none. The units differ, so no vendor-disclosed figures can be combined into a share.
Sources
https://www.datadoghq.com/state-of-containers-and-serverless/
https://survey.stackoverflow.co/2025/technology
https://cloud.google.com/blog/products/serverless/whats-new-for-cloud-run-at-next26
https://www.srgresearch.com/articles/q2-cloud-market-passes-143-billion-highest-growth-rate-in-eight-years
https://www.quantumrun.com/consulting/cloud-computing-industry-statistics/
