

Today’s Linux server workloads are far more complex than they were a few years ago. Containers, virtual machines and AI-related processes now run simultaneously in greater numbers, forcing system administrators to find new ways to observe performance without having to rely entirely on heavy web dashboards.

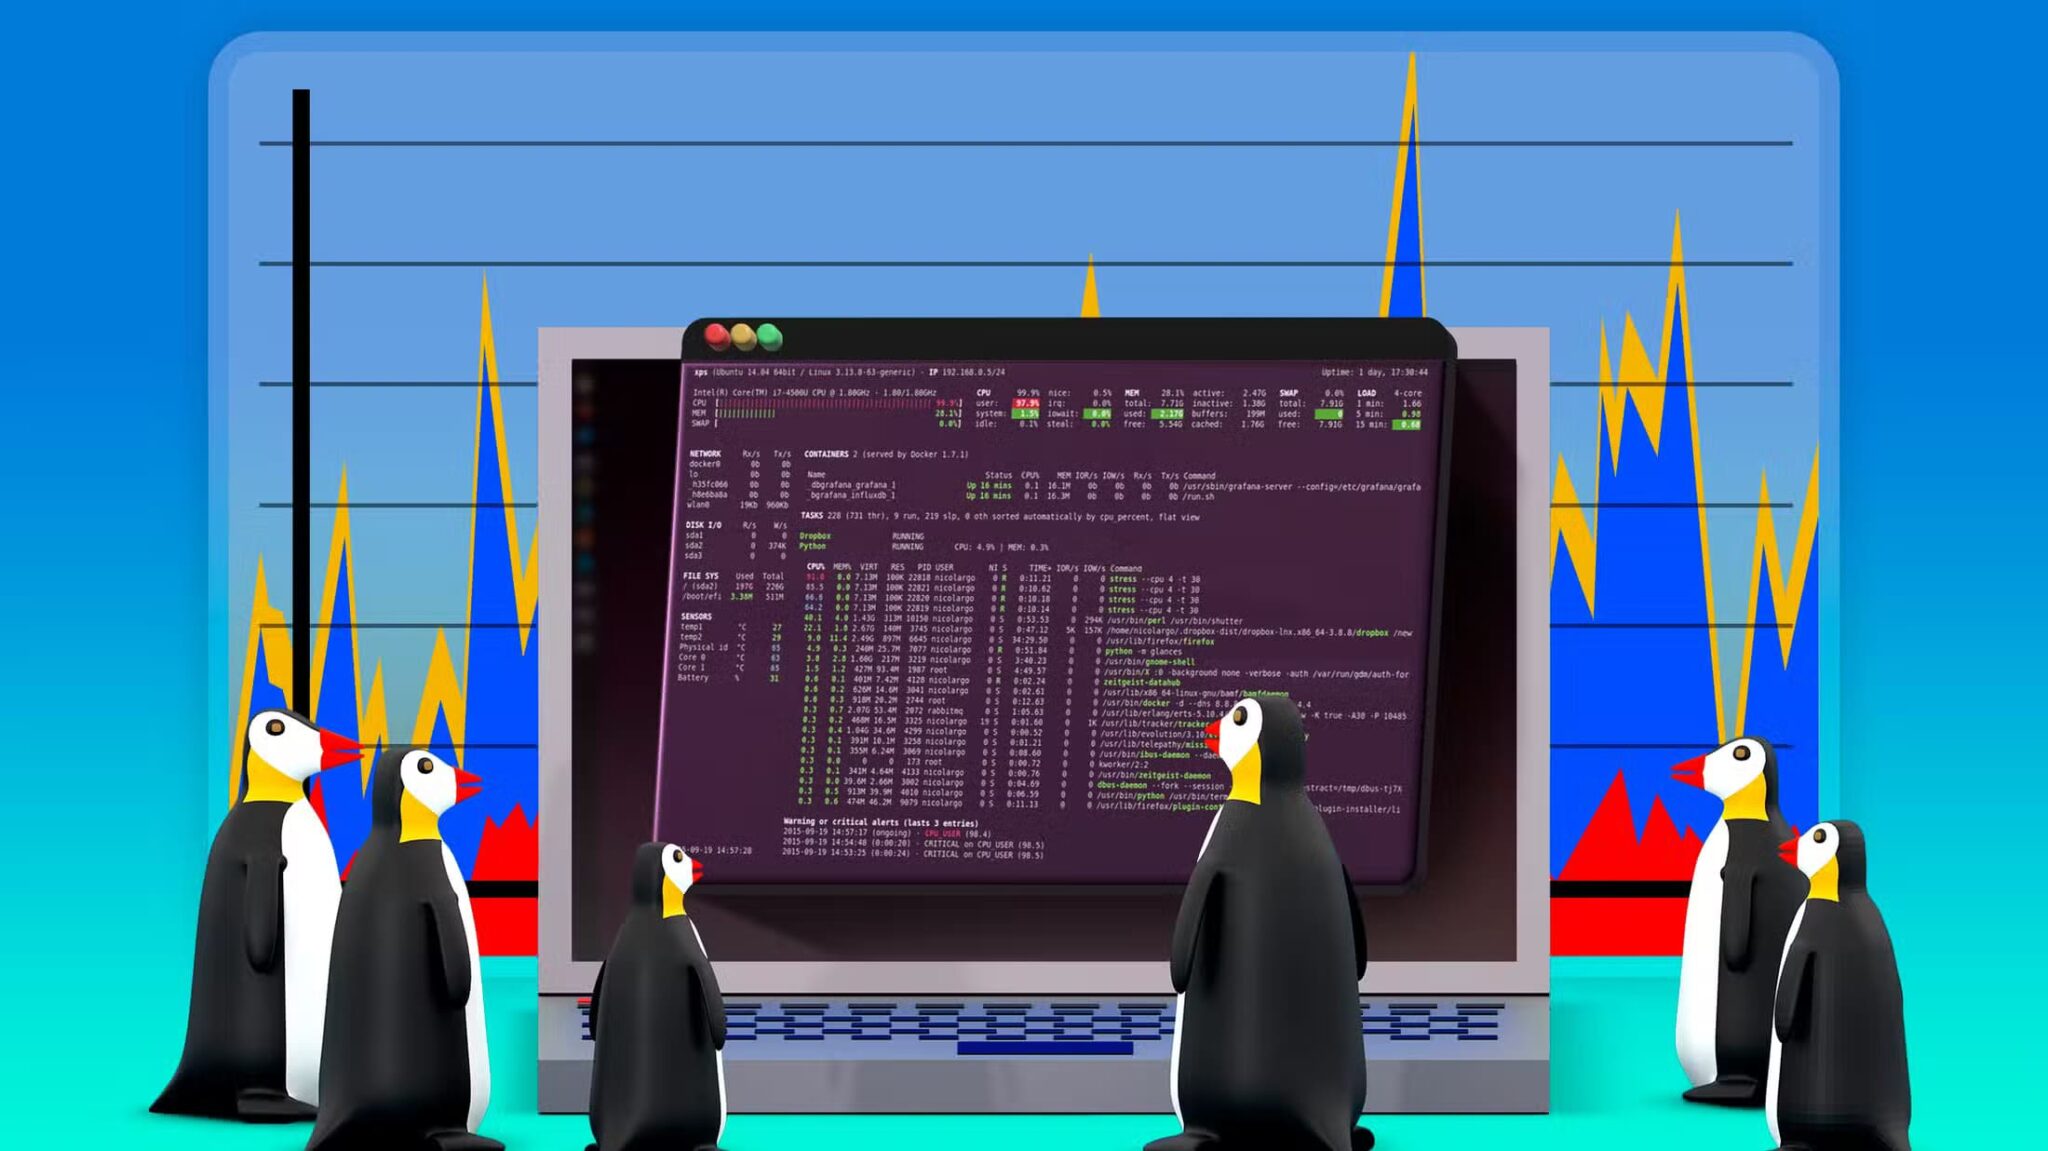
This phenomenon explains why terminal-based tools such as htop, glances and netdata are becoming increasingly popular.
All three offer real-time views directly from the shell, something highly valuable when sysadmins need to act quickly during an incident. This article highlights the reasons behind this shift and its impact on daily operations.
The Rise of Terminal-Based System Monitoring Tools
The demand for lightweight monitoring tools is closely tied to the growth of regional cloud infrastructure. Asia Pacific is now the fastest-growing region in the global data center infrastructure market, a trend that directly increases the number of Linux servers that need to be supervised every second.
For sysadmins, this means web dashboards alone are no longer sufficient. They need tools that can be opened instantly through an SSH session, without waiting for a proxy server or additional network delays.
This is why htop and glances remain relevant even as modern observability stacks like Prometheus and Grafana continue to mature.
How Sysadmins Customize Performance Monitoring Configurations?
Most system administrators now customize their monitoring configurations according to the type of workload being run.
Servers handling high-traffic web applications may prioritize CPU usage and network connections, while database servers focus more on disk I/O and memory usage. This customization is important because not all services have the same load patterns throughout the day.
High-load online services are a good example of how performance monitoring directly impacts user experience. Streaming platforms serving millions of concurrent viewers collapse under latency spikes that would barely register on a low-traffic site.
E-commerce platforms processing thousands of transactions per minute lose revenue with every second of checkout delay. Financial trading platforms execute orders in milliseconds where any lag directly translates to monetary loss.
Online gambling, where online casino Malaysia listings cover platforms with real-time game sessions and live dealer streams, demand the same zero-tolerance approach to latency.
For sysadmins, this means alert thresholds need to be carefully set so that performance issues can be detected before they become major disruptions.
Use Cases Across High-Load Online Services
The expansion of cloud infrastructure in the region has also contributed to increased demand for real-time monitoring.
The launch of public data center regions closer to Southeast Asia, as described in Microsoft’s commitment to cloud infrastructure expansion, means more Linux workloads will run at a regional scale. This indirectly increases the number of nodes that operations teams need to monitor simultaneously.
High-load online services—whether financial transaction platforms, media applications or digital entertainment services—all share the same fundamental requirement: fast response times during traffic spikes.
Sysadmins managing such servers typically run terminal tools first to identify the root cause of a problem before delving into deeper historical metrics.
Monitoring Automation Becomes the New Standard in Linux Environments
Automation is now becoming an additional layer to manual monitoring. Monitoring scripts scheduled via cron, combined with tools like netdata, allow sysadmins to receive automatic alerts without needing to watch the terminal at all times. This approach reduces manual workload while still providing a real-time view when needed.
Many modern operational guides also emphasize the importance of regularly checking CPU usage using practical methods as described in the guide to checking CPU usage, as part of routine server maintenance.
This trend shows that real-time performance monitoring is no longer an optional extra, but a fundamental part of efficient and responsive Linux system management today.
