

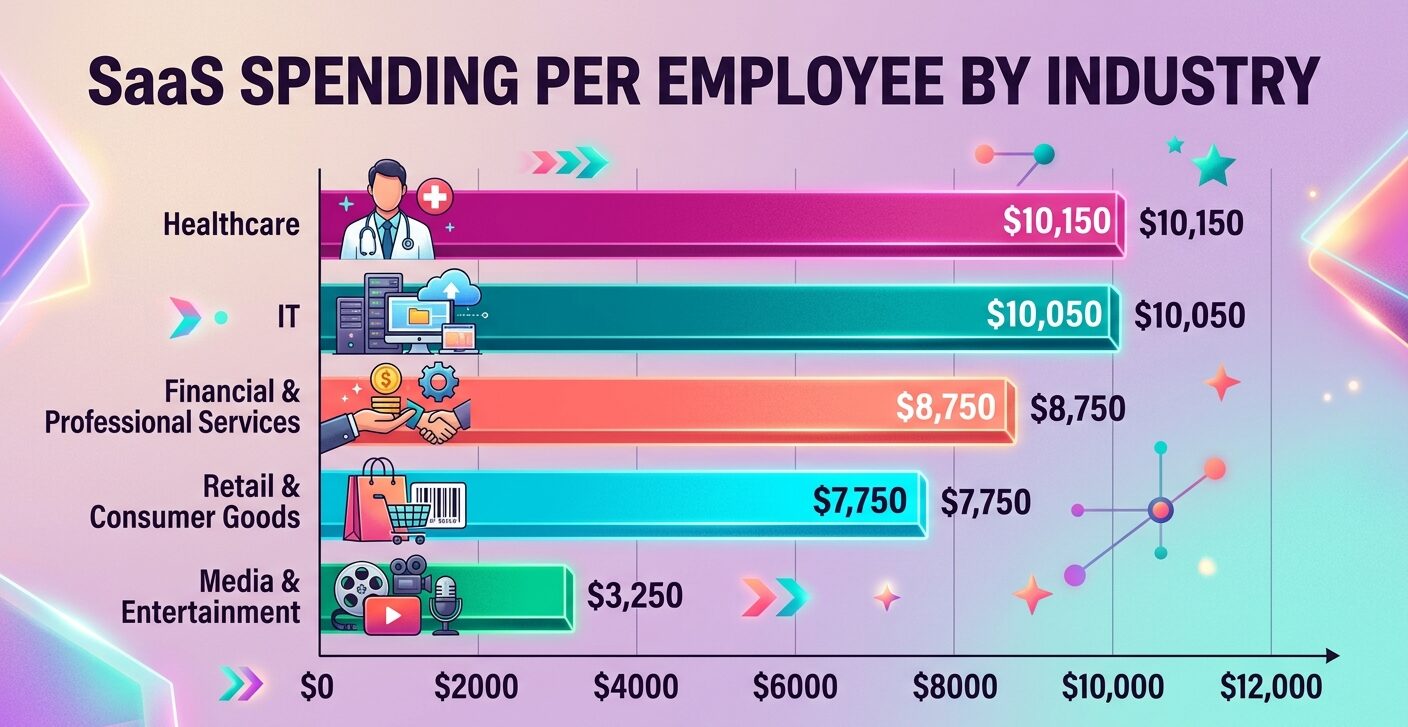
Vertice put average SaaS spend per employee at $9,324 for Q2 2026. Its Q1 2025 sector split runs from $3,250 in media and entertainment to $10,150 in healthcare.
This page breaks down SaaS spending per employee by industry and department, then covers the inflation, license waste and AI purchasing data behind those benchmarks.
SaaS Spending Per Employee by Industry
Which Industry Has the Highest SaaS Spending Per Employee?
Healthcare ranks first among the five sectors Vertice names, at $10,150 per employee per year in Q1 2025. IT companies follow at $10,050.
Financial & Professional Services sits at $8,750 and Retail & Consumer Goods at $7,750. Media & Entertainment trails at $3,250.
| Industry | Annual SaaS spend per employee |
|---|---|
| Healthcare | $10,150 |
| IT | $10,050 |
| Financial & Professional Services | $8,750 |
| Retail & Consumer Goods | $7,750 |
| Media & Entertainment | $3,250 |
Source: Vertice, SaaS Spend per Employee report, Q1 2025
Vertice’s July 2026 update reports only the all-industry average, without a new sector breakdown.
Media & Entertainment: Down Every Quarter Since Late 2023
Media & Entertainment is the only sector in Vertice’s data to drop consistently each quarter since late 2023. Vertice ties its low spend to simpler stacks of creative tools, CMS platforms and operational software.
Based on client engagements, Vertice also links the decline to media firms replacing legacy software with cheaper AI image and video tools.
Healthcare’s software needs are costlier and more industry-specific, Vertice notes. Server-side requirements for that sector are covered in our guide to Linux servers that hold patient data.
Source: Vertice, SaaS Spend per Employee report, Q1 2025
Financial & Professional Services Fell From $9,500 to $8,750
Spend per head in Financial & Professional Services dropped from $9,500 to $8,750 year over year, based on Vertice’s Q1 2025 data.
Vertice attributes the decline to firms building tools in-house with generative AI instead of paying for third-party subscriptions. Platform choices in the same sector appear in our banking and finance OS market share report.
Source: Vertice, SaaS Spend per Employee report, 2024 to 2025
Average SaaS Spending Per Employee Reached $9,324 in Q2 2026
| Period | Average annual SaaS spend per employee | Change reported by Vertice |
|---|---|---|
| Q1 2025 | $9,000 | +5% vs. March 2024 |
| Q3 2025 to Q1 2026 | $9,200 | Flat for three straight quarters |
| Q2 2026 | $9,324 | +1.3% vs. Q1 2026 |
Source: Vertice, SaaS spend per employee, Q1 2025 to Q2 2026
Q2 2026 brought the first quarter-over-quarter rise in over a year. Vertice links it to faster SaaS inflation, AI features moving to paid add-ons, and unused licenses.
The company expects per-employee spend to keep climbing through the rest of 2026 unless buyers renegotiate renewals and cut unused licenses.
Source: Vertice, SaaS spend per employee update, July 2026
Zylo’s 2026 SaaS Management Index puts the median at $9,455 per employee. That median comes from a separate dataset of 40 million-plus licenses and $75 billion in spend, so it sits beside Vertice’s average rather than replacing it.
Source: Zylo, 2026 SaaS Management Index, January 2026
How Does SaaS Spend Per Employee Differ by Department and Company Size?
Marketing spends $13,250 per employee on SaaS, Sales $10,250 and Engineering $6,750, according to Vertice’s 2025 department benchmarks.
Vertice’s report text gives no dollar figure for Finance but says its SaaS cost per employee is more than double that of HR and Engineering. The report points to costly ERP and planning tools used by small teams.
Engineering headcount tends to be comparable to Sales and Marketing, yet its spend per head is far lower. Tool adoption on that side is tracked in our CI/CD tool market share data.
Source: Vertice, SaaS Spend per Employee report, May 2025
12-Month Change by Department
| Department | Change in SaaS spend per employee, prior 12 months |
|---|---|
| Marketing | +3% |
| Sales | +4% |
| HR and Engineering | +8% |
Source: Vertice, SaaS Spend per Employee report, May 2025
Company Size: Mid-Market Up 40%
Spend per employee rose in all three company-size bands between Q1 2024 and Q1 2025.
| Company size | Change in SaaS spend per employee |
|---|---|
| Mid-market | +40% |
| Enterprise | +28% |
| SMB | +21% |
Source: Vertice, SaaS Spend per Employee report, Q1 2024 to Q1 2025
For SMBs, Vertice cites rising list prices and vendors bundling features into higher-tier plans.
SaaS Price Inflation Hit 16.4% in June 2026
Vertice’s SaaS inflation rate rose from 12.1% in April 2026 to 14.2% in May and 16.4% in June. June’s reading is the highest monthly rate in Vertice’s records, above the 14.7% set in November 2025.
The 4.3-point climb over two months is the fastest increase Vertice has recorded. Its Q1 2026 rate was 13.2%, and Vertice compares June’s rate with a US CPI of 4.2%.
Source: Vertice, SaaS inflation rate, April to June 2026
How Many SaaS Licenses Go Unused?
Vertice classed 65% of SaaS licenses as unused or underutilized in Q2 2026, up from 62% a year earlier. It counts a tool as underutilized when fewer than half of its purchased licenses are in use.
Fully unused licenses fell from 15% to 14%, while underutilized licenses rose from 47% to 51%. Combined waste peaked at 69% in December 2025.
Source: Vertice, Unused SaaS applications, Q2 2026
Zylo uses a different yardstick. Measured against industry-recommended utilization levels, organizations in its 2026 index leave 36% of licenses unused.
Source: Zylo, 2026 SaaS Management Index, January 2026
Zylo’s 2026 Index: Who Controls Enterprise SaaS Spend
Business units control 81% of SaaS spend in Zylo’s 2026 index, while IT directly manages 15%.
Average annual SaaS spend reached $55.7M, up 8% year over year, against a median of $20.6M. At large enterprises, annual SaaS spend rose about 16%.
Portfolios averaged 305 apps, with a median of 240, and overall app counts dipped 0.07%.
Large enterprises still add 21 applications per month on average. Desktop fleets at that scale are tracked in our enterprise desktop OS deployment figures.
In a Zylo survey of 218 IT leaders, 78% reported unexpected charges tied to consumption-based or AI pricing over the past 12 months. Another 61% cut projects because of unplanned SaaS cost increases.
Source: Zylo, 2026 SaaS Management Index, January 2026
AI-Native App Spend Up 108%
Spend on AI-native apps rose 108% year over year, and 393% at organizations with more than 10,000 employees. Zylo’s chart puts average AI-native app spend at $4.7M for companies with 10,001+ employees.
Expense-based SaaS spend grew 267%, and ChatGPT is now the most expensed application. Self-hosted alternatives show up in our open-source AI model download data.
Source: Zylo, 2026 SaaS Management Index, January 2026
What Does Gartner Forecast for 2026 Software Spending?
Gartner’s July 2026 forecast puts worldwide software spending at $1,468 billion for 2026, up 15.5%. The release does not break out SaaS.
| Segment | 2025 spending (B) | 2026forecast(B) | 2026 growth |
|---|---|---|---|
| Software | 1,271 | 1,468 | 15.5% |
| Infrastructure as a Service (IaaS) | 222 | 287 | 29.3% |
| Data Center Systems | 506 | 822 | 62.5% |
| Overall IT | 5,577 | 6,369 | 14.2% |
Source: Gartner, Worldwide IT Spending Forecast, July 2026
Across four editions, Gartner’s 2026 software growth forecast moved from 15.2% in October 2025 to 14.7% in February 2026, 15.1% in April 2026 and 15.5% in July 2026.
Gartner’s John-David Lovelock said technology budgets are strained by inflation, supply shortages, rising hardware and memory costs, and AI funding. Cloud platform detail sits in our serverless adoption by cloud provider breakdown.
Source: Gartner, Worldwide IT Spending Forecast editions, October 2025 to July 2026
FAQs
What is the average SaaS spend per employee in 2026?
About $9,324 per year in Q2 2026, based on Vertice data, up 1.3% from $9,200 in Q1 2026. Zylo’s 2026 SaaS Management Index reports a separate median of $9,455 per employee.
Which industry spends the most on SaaS per employee?
Healthcare ranks first at $10,150 per employee in Vertice’s Q1 2025 industry data. IT follows at $10,050, while Media & Entertainment spends the least of the five named sectors at $3,250.
Why is SaaS spend per employee rising in 2026?
Vertice links its Q2 2026 increase to SaaS inflation, which reached 16.4% in June 2026, plus AI features moving to paid add-ons and unused licenses.
How many SaaS apps does the average company use?
Organizations in Zylo’s 2026 index hold 305 SaaS apps on average, with a median of 240. App counts dipped 0.07% year over year, while average annual SaaS spend rose 8% to $55.7M.
What do benchmarks say when Reddit users ask if $10,000 per employee on SaaS is too much?
It sits close to published figures. Vertice recorded $10,150 per employee in healthcare and $10,050 in IT in Q1 2025, against an all-industry average of $9,324 in Q2 2026.
